Your results in perspective using the benchmark
When analyzing survey results, it’s natural to ask questions like, “Is this good or bad?” and “Is this normal?” For instance, a score of 7 might seem acceptable, but what does it really mean?
To properly interpret your results, you need to put them in context. In other words, you need a basis for comparison. The key advice here is: avoid comparing apples to oranges. Ideally, compare your results with previous measurements or with results from other departments within the organization. This provides a clearer picture.
Sometimes direct comparisons aren’t possible, and that’s understandable. In such cases, comparing with other relevant benchmarks can still offer valuable insights. However, keep in mind that these comparisons are not perfect substitutes—they are still apples and oranges.
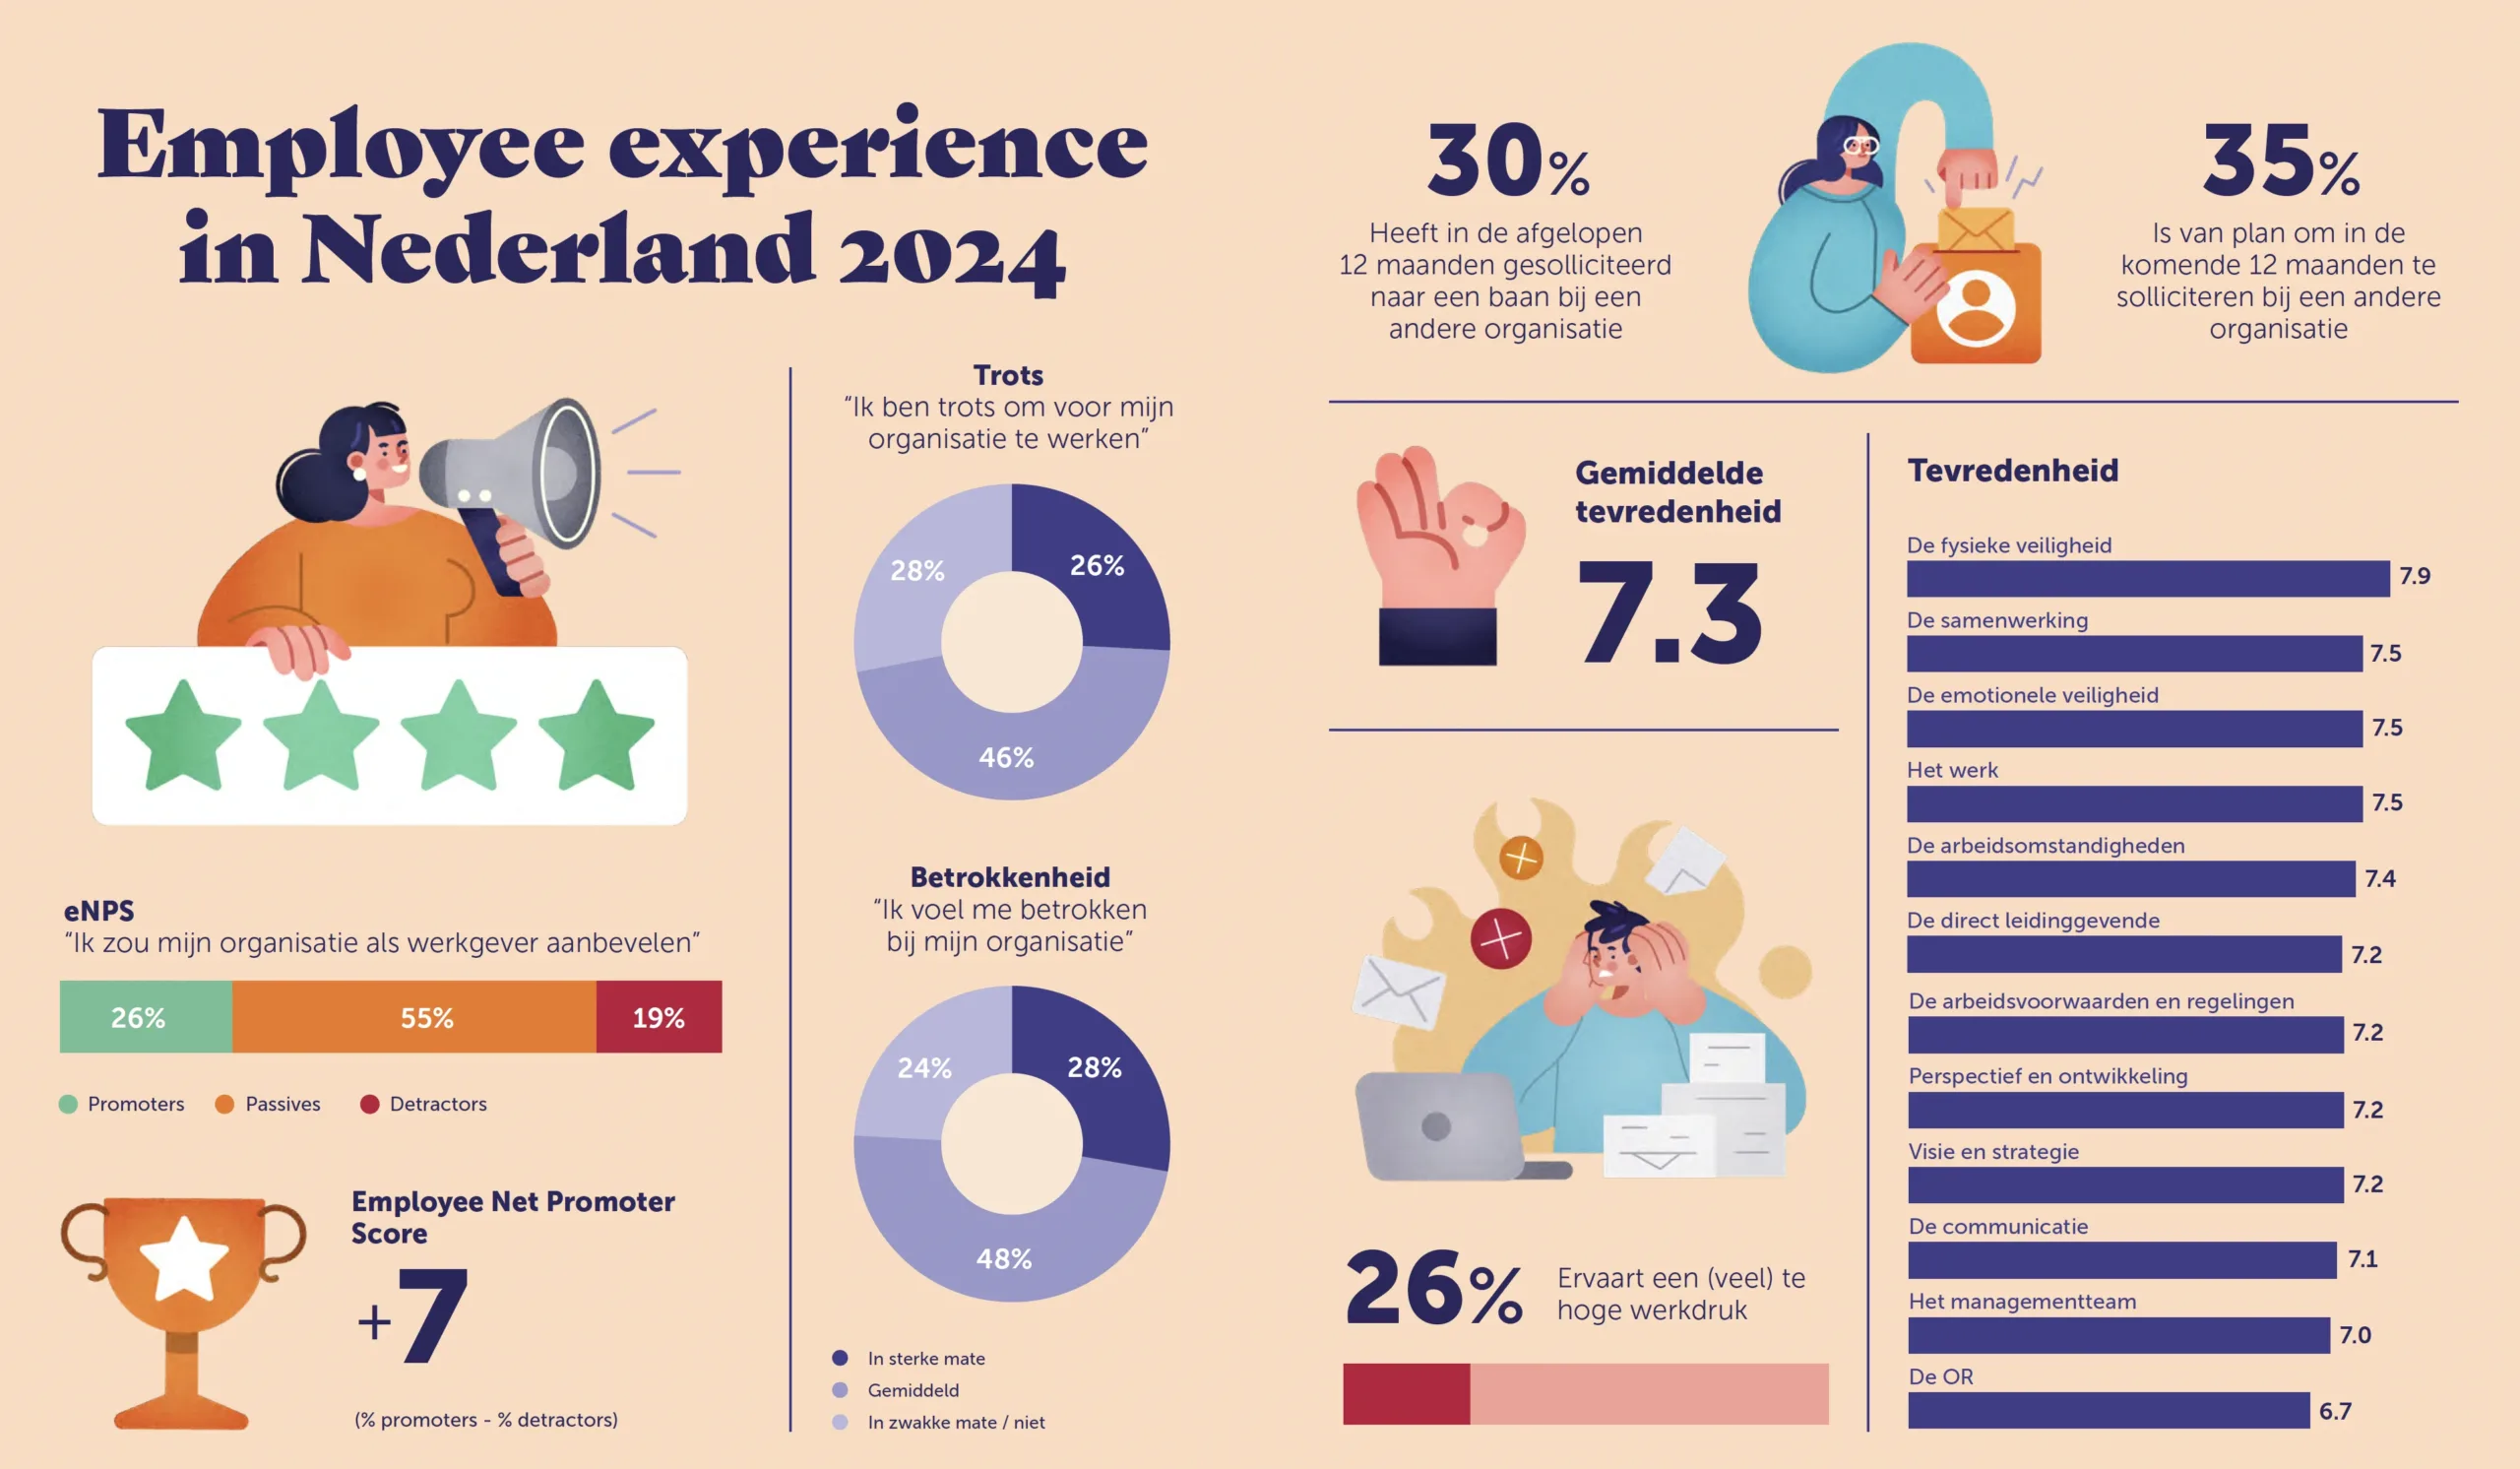
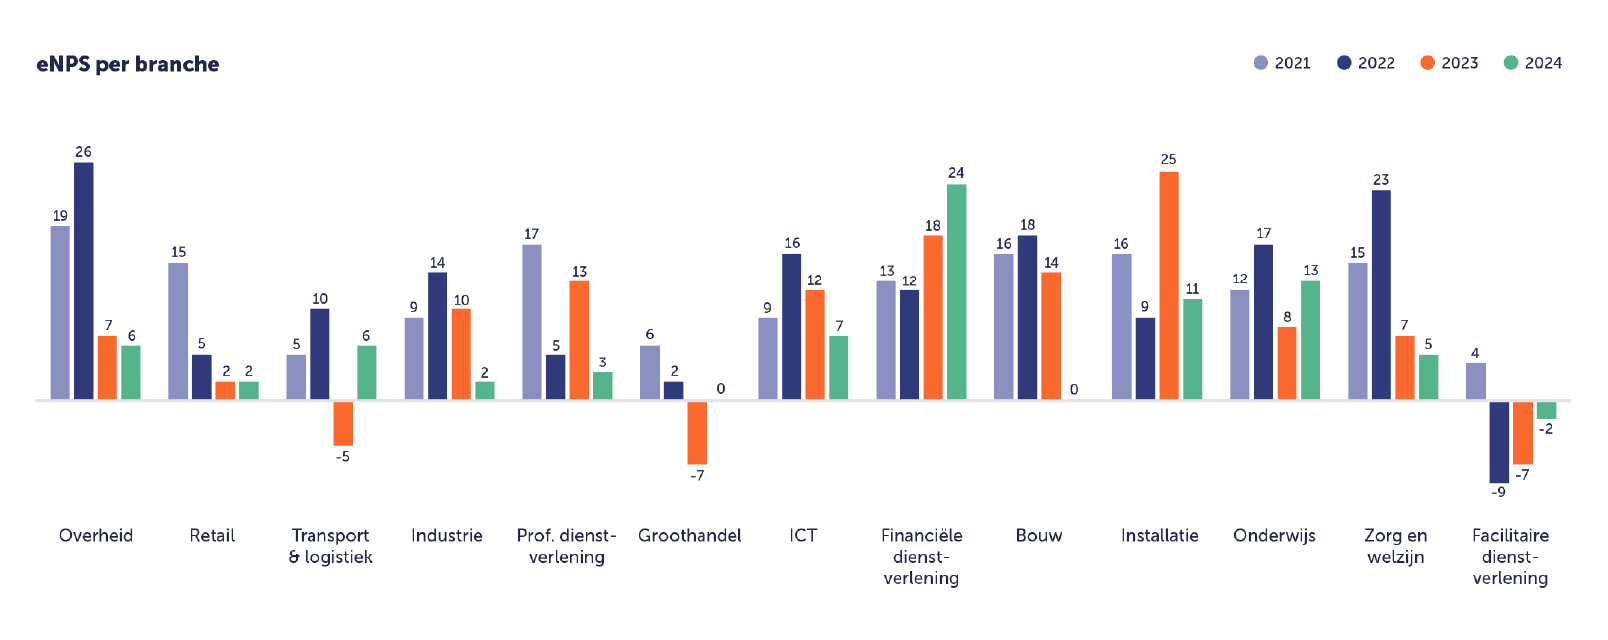
Below, we provide results such as eNPS and satisfaction scores based on the standard Integron questionnaire for working people in the Netherlands. We also offer insights into various industries. We present a comprehensive overview, and it’s up to you to determine what is most relevant to your situation.
Would you like more detailed information? Download the report on employee experience in the Netherlands here.
We are currently translating the text in the images on our website. We appreciate your patience and encourage you to check back later for the updated content.

