Research methodology
To properly understand the results of the study, it is first important to know a little more about the methodology that was used.
It is important that you understand the following:
- What the eNPS® is and how it is measured.
- The satisfaction and importance scale and its priority matrix.
- The (un)agree scale and how it is interpreted.
Probably the survey also measured the level of employee pride and commitment. We used the same methodology as the eNPS for this. So if you understand this, it’s just a matter of applying the same trick and then you can work with this as well, simple!

Employee Net Promoter Score (eNPS)
The Employee Net Promoter Score (eNPS) is a widely used method for measuring employee enthusiasm within an organization. It provides insight into how likely employees are to recommend the organization as a place to work. This is assessed with a single question: “How likely are you to recommend this organization as an employer to acquaintances?” The underlying idea is that enthusiastic employees are more likely to advocate for their employer to friends and family.
Measuring eNPS
The eNPS is measured on an 11-point scale, ranging from 0 (very unlikely) to 10 (very likely). Based on their responses, employees are categorized into one of three groups:
- Promoters (Scores of 9 or 10)
Promoters are highly enthusiastic employees who actively recommend the organization to others. They are seen as ambassadors for the organization, exuding inspiration and enthusiasm. These employees are often the driving force behind growth and change within the organization. They proudly share their positive experiences and typically have lower turnover and absenteeism rates. In short, promoters bring contagious energy and contribute significantly to organizational growth. - Passives (Scores of 7 or 8)
Passives are generally satisfied but not particularly enthusiastic. While they do not express negativity, they are also not likely to speak highly of the organization outside of work. Their level of pride and commitment is lower compared to promoters, and they tend to have higher turnover and absenteeism rates. Passives are neutral in their recommendations, and their engagement is less impactful. - Detractors (Scores of 6 or lower)
Detractors are dissatisfied employees who are unlikely to recommend the organization. They may feel their needs are not being met and often lack enthusiasm and loyalty. Detractors can be disengaged, frequently talking negatively about the organization. This group typically experiences higher turnover and absenteeism, and they lack pride in their work.
Analyzing eNPS results
The eNPS is calculated by subtracting the percentage of detractors from the percentage of promoters. This score indicates whether there are more promoters or detractors in the organization. To gain a deeper understanding of the reasons behind employees’ recommendations, a follow-up question is often asked to explore their motivations and feedback further.


Satisfaction and importance
In the questionnaire, employees were presented with several items. An example of an item is “communication between teams. These items all belong to a particular theme, for example, “communication.
Two questions were asked for each item:
- Satisfaction: What is your experience with this item?
- Importance: How important do you think this item is?
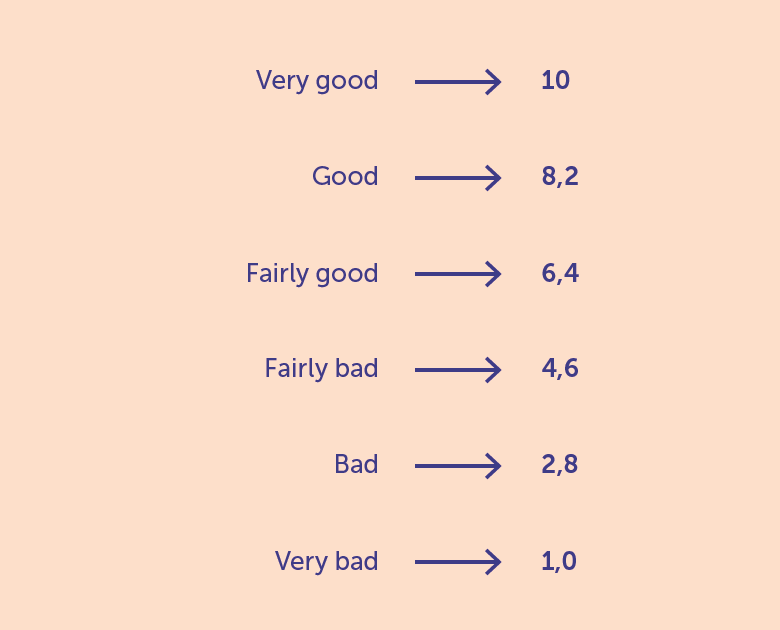
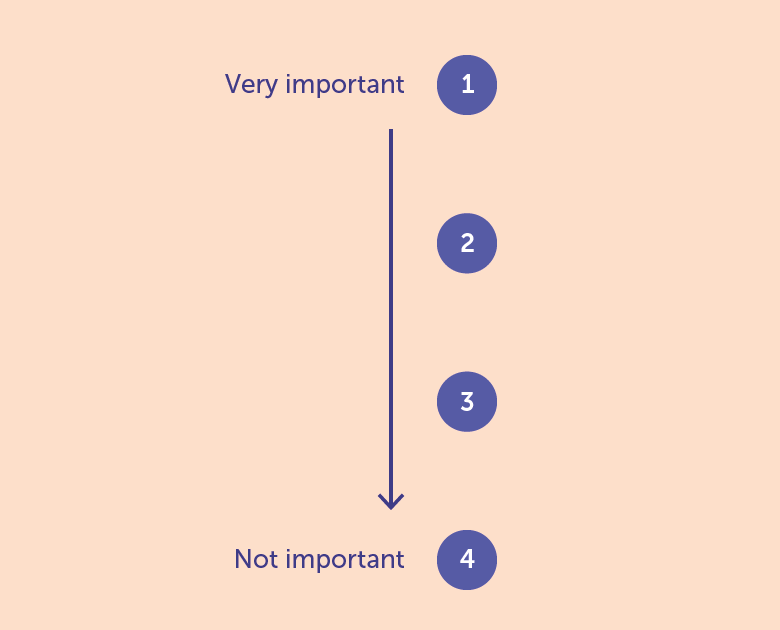
For satisfaction, a scale was used from very good to very bad. Later, these answers were converted to a score. So the scores you see in your dashboard are not literally given by employees, this is a calculation made later by Integron. For importance, a scale was used from very important to unimportant. These answers were also converted later.


Priority Matrix
While employee satisfaction scores are insightful, they alone don’t provide a complete picture. It’s important to understand not just what employees are dissatisfied with, but how critical those issues are to overall job satisfaction.
Consider this example: Suppose you receive a new pen from your employer with the company logo on it. The pen writes well, but you dislike the color yellow. Although this minor issue is annoying, it doesn’t significantly impact your job satisfaction. In contrast, if you notice that the atmosphere among two of your direct colleagues is tense, this affects your daily work experience.
In a survey, you might see that the pens are rated 4 and the atmosphere is rated 6. Relying solely on these satisfaction scores might lead you to prioritize ordering new pens, while neglecting to address the atmosphere, which has a greater impact on job satisfaction.
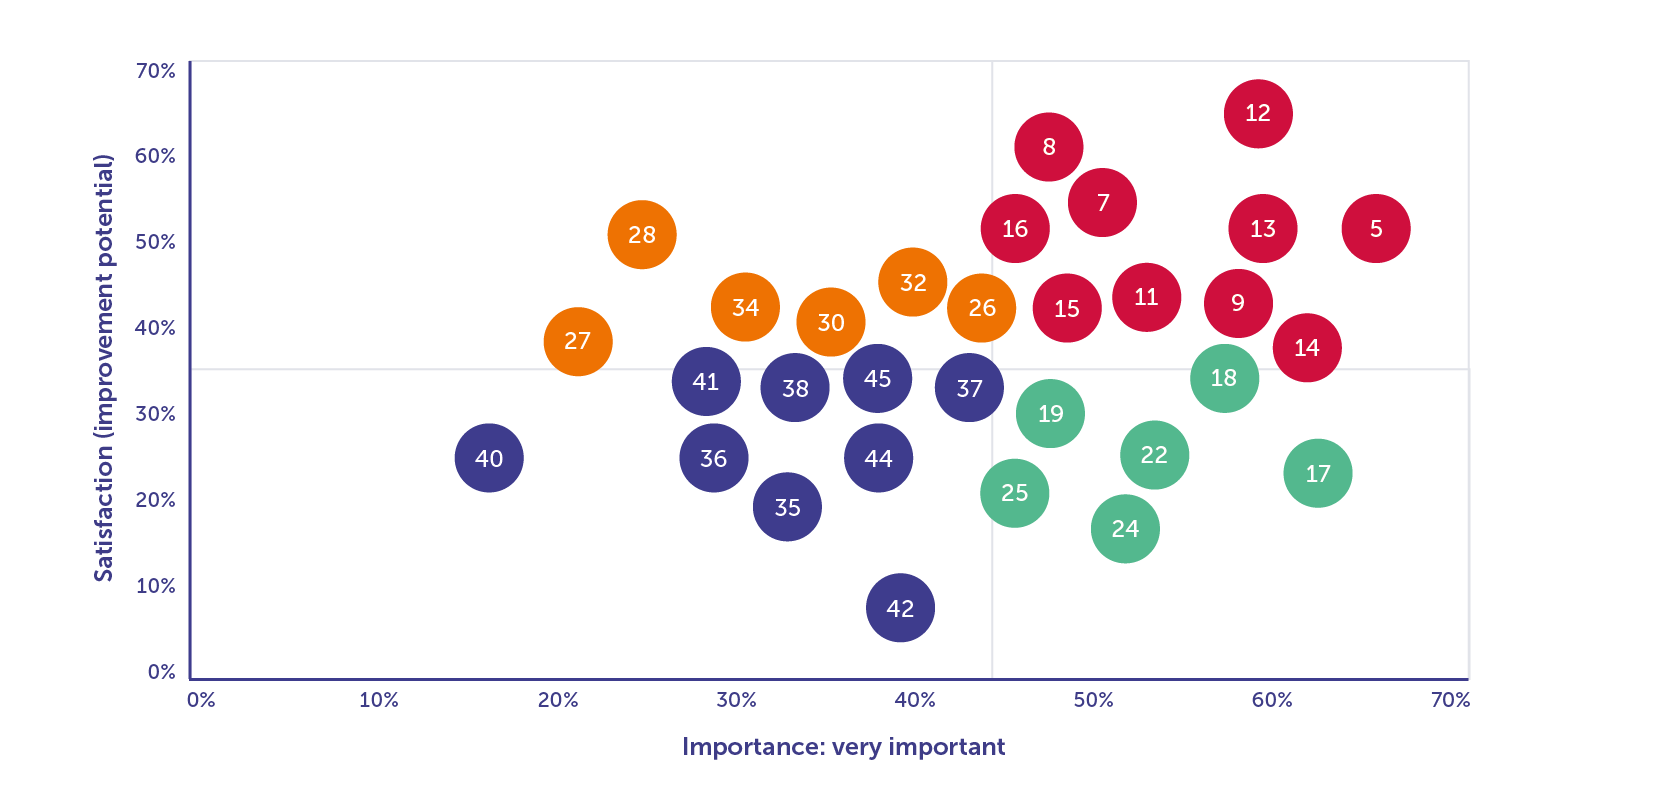
The Priority Matrix helps to clarify which issues to address first. It consists of two axes:
- Horizontal Axis: Importance
This axis indicates how important an issue is to employees. The further to the right, the more important the issue is perceived to be by employees. - Vertical Axis: Improvement Potential
This axis shows how much room there is for improvement. It reflects the percentage of employees who have rated an issue as reasonably good, reasonably bad, bad, or very bad. A higher position on the axis indicates greater improvement potential.
How to use the Priority Matrix:
- Plotting Items: All items (questions) from the survey are plotted on this matrix.
- Color Coding:
- Red: Items with above-average importance and above-average room for improvement. These are the priorities you should address.
- Green: Items with above-average importance but below-average room for improvement. These are your strengths that you need to maintain.
- Orange: Items with below-average importance but above-average room for improvement. These are risks. They are less critical now but offer significant potential for improvement.
- Blue: Items with below-average importance and below-average room for improvement. These issues are less urgent and should not be a primary focus.
Focus on the green and red items. These represent the issues most important to employees and those that need the most attention.

(Dis)agree scale
It is possible that the survey presented some statements to employees. These statements could, for example, be about the core values of the organization. Employees have indicated to what extent they agree or disagree with these statements.
The following scale was used: completely agree, agree, neutral, disagree and completely disagree. The question is then: how do you interpret this result and when can you speak of a good result? For this we add up the percentage of completely agree and agree. Is this percentage then at least 60%? Then you can generally say that the statement is well recognized by employees. Is this percentage at least 80%? Then the statement is even very well recognized. If the percentage of (fully) agree is still lower than 60%, there is still some work to be done. The goal should certainly be 80%. Especially when it comes to something as essential as the core values of your organization, at least 80% of the employees should experience this as such.